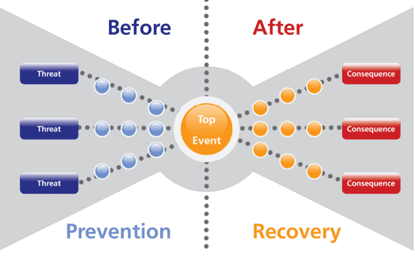
| The BowTie method is a qualitative risk analysis method that can be used to systematically obtain a picture of the risks present in an organization and the preventive and protective measures that (can) be deployed in response to them. Risks, threats, preventive and protective measures are united in one model. At the center is the undesired event. On the left are the causes, on the right the consequences. Protective measures are shown in the form of barriers. | In this contribution I write my own opinion, not that of any organization |
Overview
The bowtie analysis is a simple way in the form of a figure that analyzes and describes the paths of an undesirable event from its possible causes to its undesirable consequences. It is the combination of a fault tree analysis, which digs for the causes of an event, and an event tree that maps the possible consequences. But the essence of the bowtie lies in applying management measures, preventive or protective, between the causes and the event, and between the event and the consequences. Create a Bowtie from working on a fault tree and an event tree, eventually you will develop it in a single motion in one or more brainstorming sessions.
Use
Use a bowtie to illustrate the possible range of causes and consequences associated with an undesirable event. Also when one cannot justify a full fault tree analysis, or when the focus is primarily on taking action for each failing path. It is useful whenever there are independent failing paths. It is also a representation method that is easier to understand than a fault tree an event tree. Hence you can use it as a communication tool while other more complex methods are in the background for the actual analysis.
Input
You also need a degree of knowledge of the failure, its possible causes and consequences as well as possible measures that ensure prevention of the failure or protect against the consequences.
Process
The bowtie is set up as follows:
(a) Identify a particular adverse event for analysis and place it in the central node of the bowtie.
(b) List the possible known causes of the event with sources of threats in mind.
(c) Determine the mechanism by which the source of the event gives rise to the event using the method of “5 x why questions”.
(d) Draw connecting lines between the possible sequential causes giving rise to the event and the failing unwanted event. Draw these on the left side of the bowtie. Identify factors that may contribute to the escalation of the event and include them in the diagram.
(e) Identify preventive measures at the different causes and escalation factors. Draw these in the diagram as vertical stripes. Across the connecting line(s). Use this approach for opportunities where the vertical stripes represent measures for stimulating the effect and event that you want.
(f) The right side of the diagram identifies the different consequences (possibly using a method of “5 x what then?” questions) and draws connecting lines between consequences that can occur in cascade.
(g) Mark protective measures (= safeguards) to protect against consequences in the diagram as vertical stripes across the connecting line(s). Use this approach also for positive consequences, where the stripes represent the measures to encourage and support causing the consequences that you want.
(h) You can show management functions that support the measures (such as training and inspection or audit) under the bowtie and link them to the respective measure. Quantification of the bowtie is possible if the paths are independent, if you know the probability for a given consequence, and when you can paste a number on the effectiveness of the measure. In many cases, this is not possible.
Result
The result is a simple diagram showing the many possible paths and the actions to take.
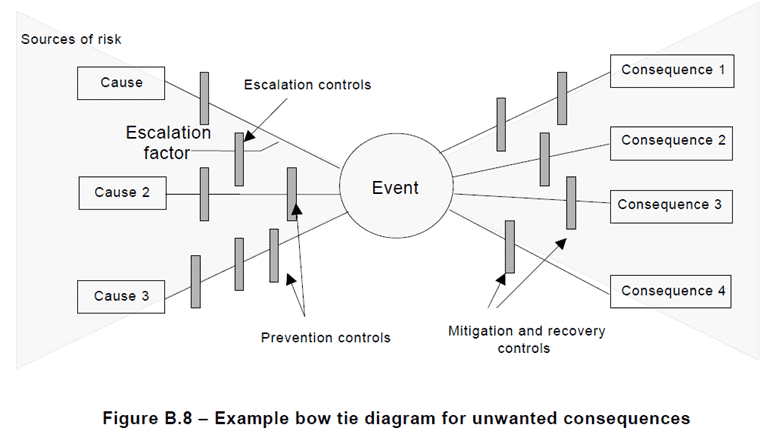
Figure – Sample bowtie diagram for undesirable consequences
Strengths and limitations of this method
Strengths:
- It is easy to understand and gives a visual picture of the problem;
- It focuses attention on the adoption of measures for prevention and protection and their effectiveness;
- You can use it for opportunities and desired consequences;
- It does not require a high degree of expertise for proper use.
Limitations:
- It does not show a detailed time sequence, it does not indicate where multiple causes occur simultaneously to initiate their path (However, one can use AND gates and OR gates in the fault tree.);
- The danger of over-simplification exists, for example, when trying to force quantification where it is not easy.
Dank je, dit is een duidelijke uitleg